Project description
Solar generation loss, from inverter telemetry alone
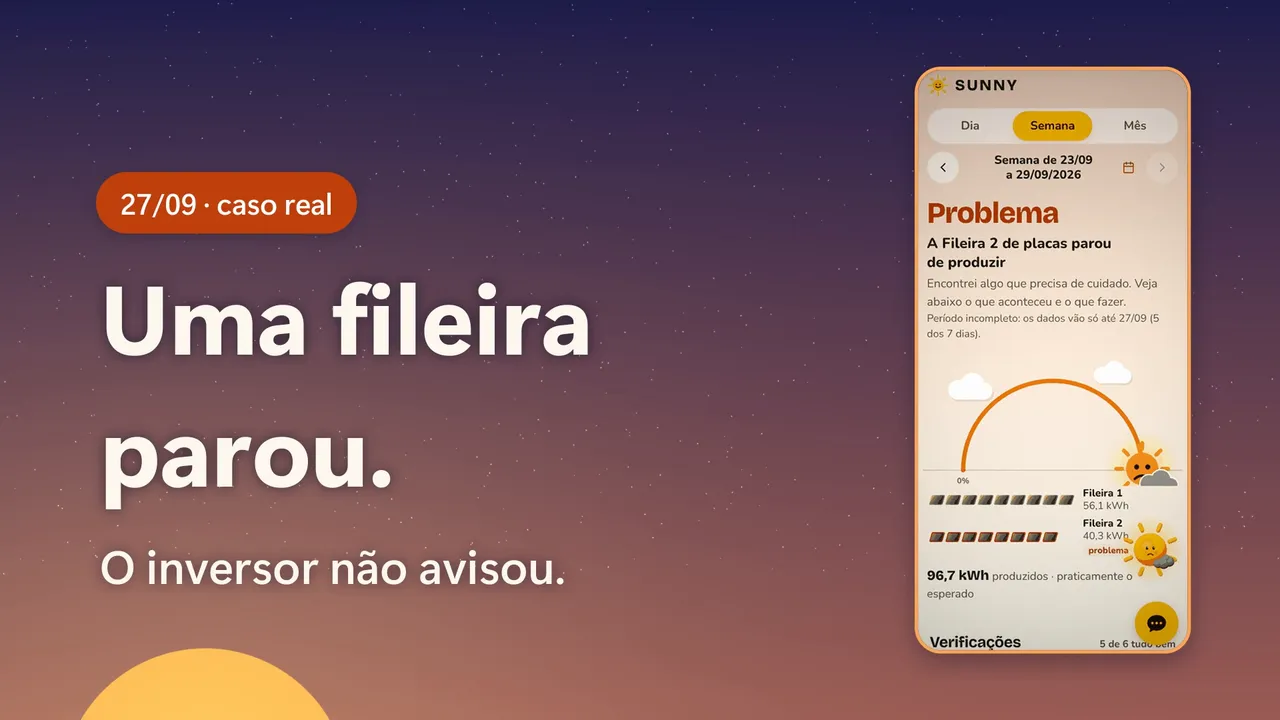
One string of panels stopped, and the inverter did not report it. From its telemetry alone, the study estimates how much the system should generate and finds the loss; Sunny explains the result in plain words.
- Role
- Co-author, in a pair
- Period
- 2026
- Status
- in progress
- Machine learning and data
- Python
- pandas
- scikit-learn
- XGBoost
- Flask
- Cloudflare Pages
Evidence
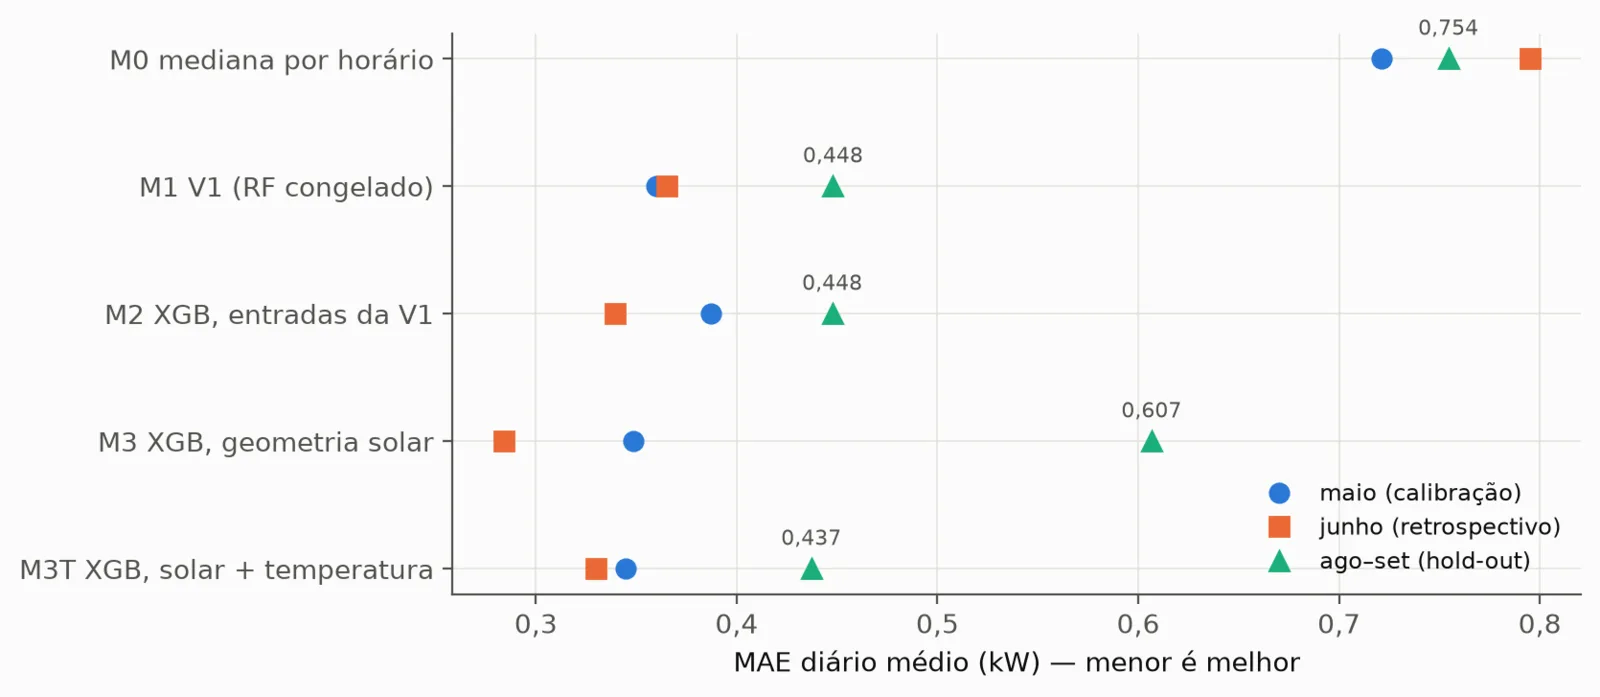
Error about 41% lower than the baseline
Mean daily MAE on the hold-out from August 1 to September 27, 2026 (55 days), opened a single time, against the median by time of day. Exploratory gain, computed after the opening.
Measured.
1 alert in 221 evaluated days
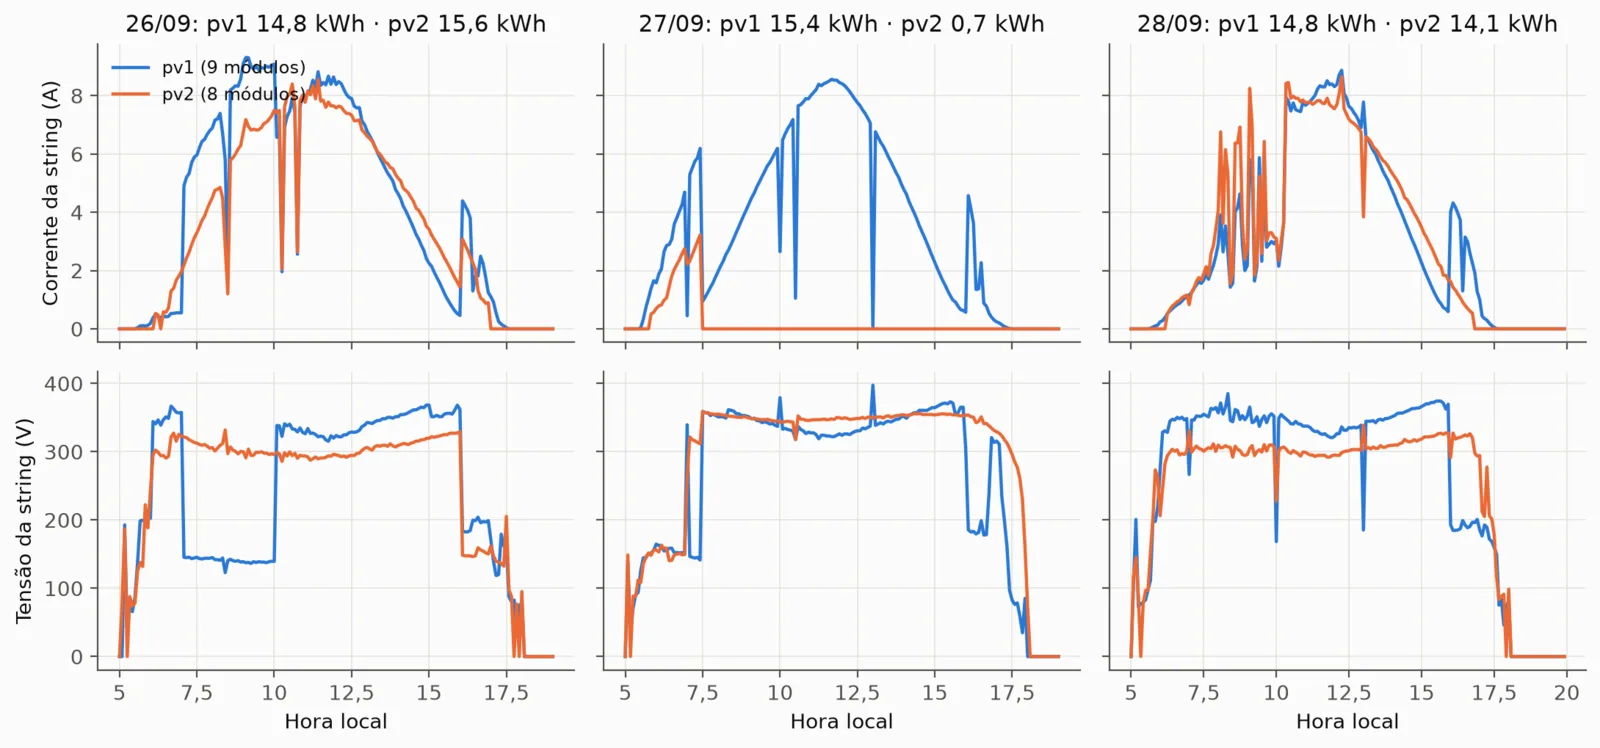
Per-string detector; 58 of those days are from the hold-out. The alert fell on September 27, on a real loss of one string that the inverter did not record.
Measured.
Model and protocol frozen by SHA-256
Hash checked before and after each stage; the program refuses to run on the hold-out again.
Measured.
The question
Is the native telemetry of a residential hybrid inverter, without measured irradiance, enough to estimate the expected power and to detect and locate generation losses?
Data
63,897 records at 5-minute intervals, with 55 variables, collected through the manufacturer’s API between January 15 and September 27, 2026. The modeling uses only daytime records from valid days.
Validation
- Five models: the baseline (median by time of day), Random Forest V1 and three XGBoost models.
- V1 was frozen on July 7 and the protocol on September 28, both by SHA-256, before the August and September hold-out was opened a single time.
- Of the three hypotheses registered before the test, two were refuted, and the thesis reports this.
Limitations
A single installation, with about eight and a half months of data. The 41% gain holds for MAE and against a deliberately simple baseline. The cause of the September 27 loss was not confirmed in the field.
On screen
Tap outside the image to close it.
Tap outside the image to close it.
Tap outside the image to close it.
Tap outside the image to close it.
How it works
From inverter telemetry to a plain-language report. The AI explains; rules and models decide.
- Telemetry
55 inverter variables, every 5 minutes, from Jan 15 to Sep 27, 2026.
Python63,897 records - Cleaning
Only daytime records from valid days. A day without enough data does not count as a day without an alert.
pandas - Expected power
The time-of-day median, Random Forest V1 and three XGBoost models estimate what the system should produce.
scikit-learn, XGBoost41% lower error - Detector
Compares the two panel strings with the sun high and locates the one that lost power.
pandas1 alert in 221 days - Report
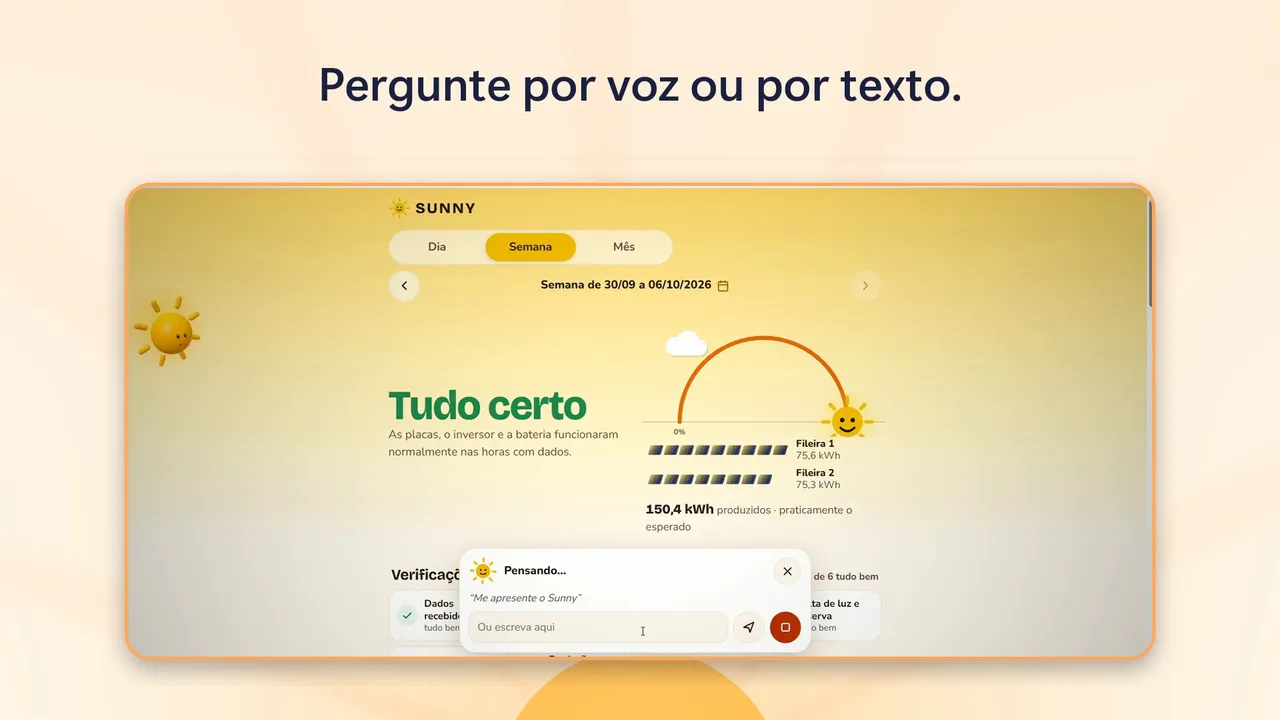
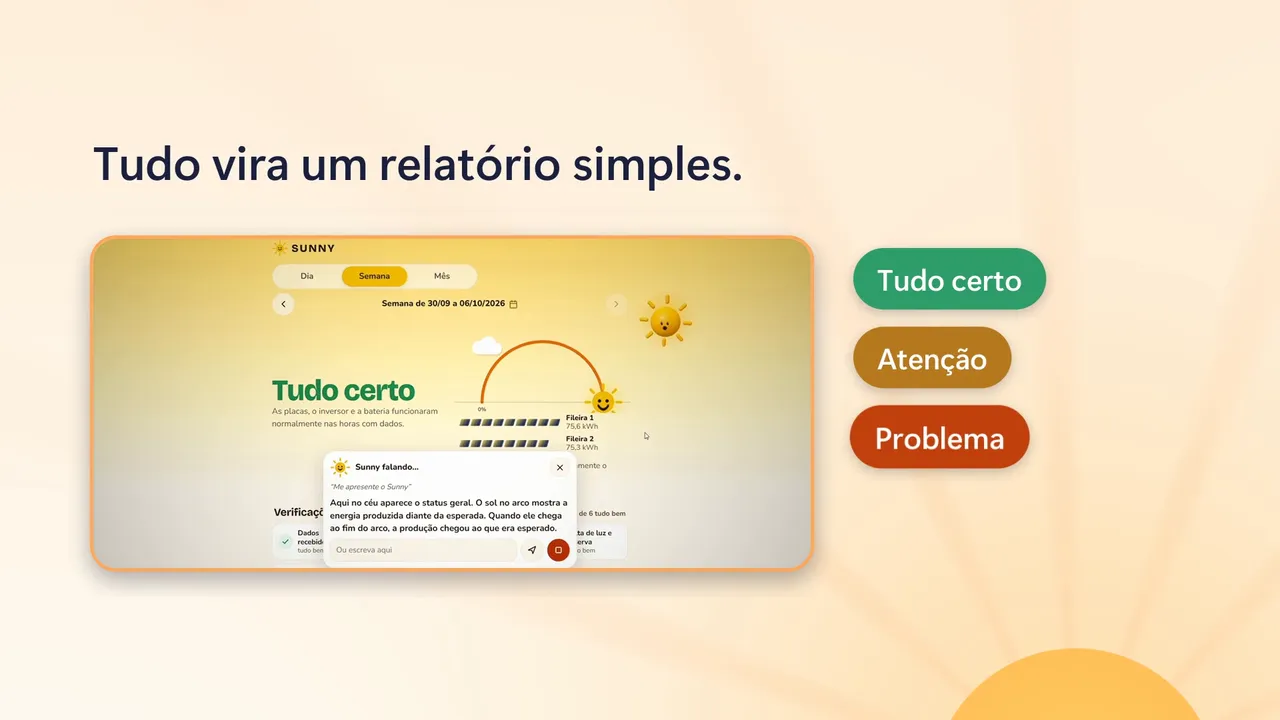
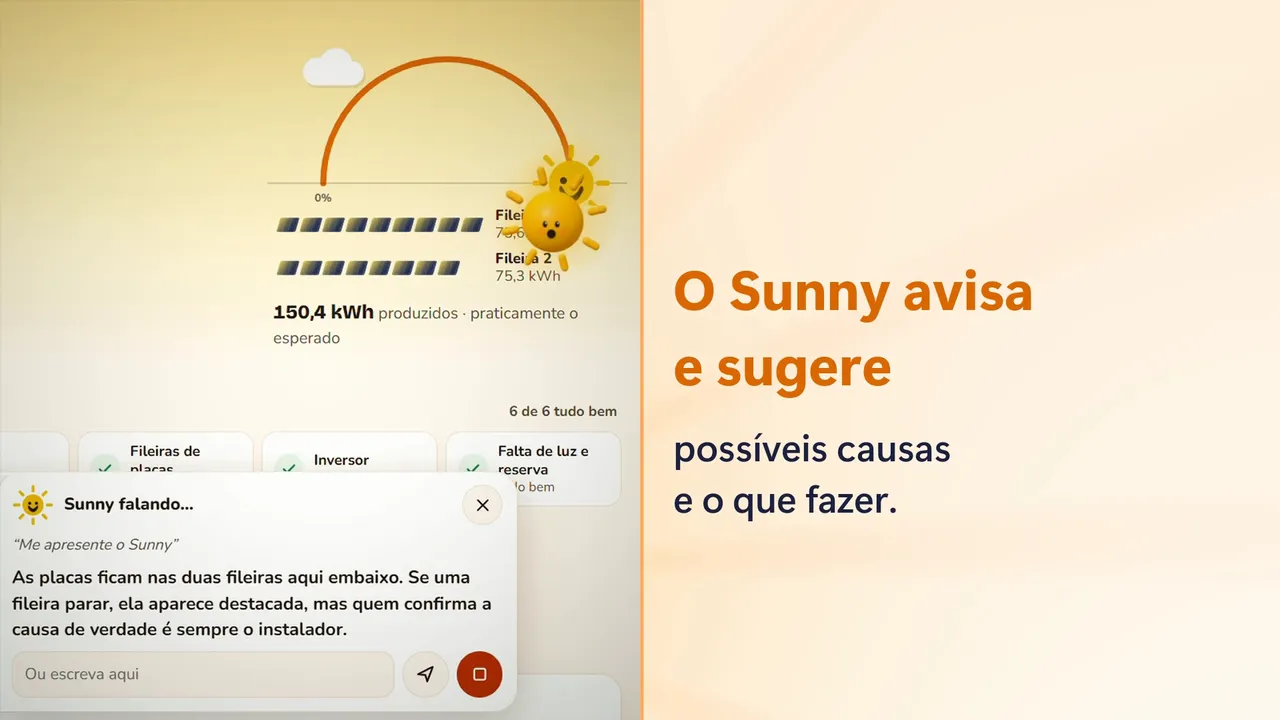
Fixed rules turn everything into All good, Attention, Problem or No data, with possible causes and what to do.
Python - Guide
An LLM assistant explains the report on screen and only runs actions from a closed list.
Three.js
The models were trained on the installation's own history and frozen. Before each stage, the program checks the SHA-256 of each one and of the protocol, and refuses to run on the reserved period again. The excerpt beside it is a simplified form of the frozen protocol.
Sunny warns and suggests. The installer always confirms the cause.
{
  "congelado_em": "2026-09-28T23:08:03",
  "abertura": "única",
  "modelos_sha256": {
    "v1": "f9302efd…ef084"
  },
  "base_sha256": "753e397c…a925"
}
Decisions
Instead of: Tuning the model while looking at the test period.
Cost accepted: Hypotheses that fail stay refuted; two of the three did, and the thesis says so.
Instead of: Comparing only sophisticated models with each other.
Cost accepted: The 41% gain holds against a naive reference, and is presented that way.
Instead of: Installing an irradiance sensor at the house.
Cost accepted: Telling clouds from faults gets harder; hence comparing one string with the other.
Instead of: Looking only at total output against expected.
Cost accepted: It needs two strings; it locates the loss but does not diagnose the cause.
Instead of: Letting the assistant make the diagnosis.
Cost accepted: More restrained answers; it talks about the report on screen and never states the physical cause.
How it was built
- Jan 15The series starts
The inverter telemetry starts being recorded every 5 minutes.
- Jul 7The Random Forest frozen
V1 is saved and checked by SHA-256 before any test.
- Sep 27The real loss
The current of string 2 stays at zero from 7:30 a.m., and the inverter records no fault.
- Sep 28The test, only once
The protocol is frozen at 11:08 p.m., and the reserved August–September period is opened only once.
- Oct 6Sunny goes live
The plain-language report goes live; on Oct 10 the voice guide and the free-floating 3D Sunny arrive.
Today and next
Today
The study is complete. Sunny is a live prototype that reads new data every day with the frozen models and explains each alert in text, with the rule used for the technician.
Next
- Continuous learning: models that evolve with new data, validated before each swap.
- More installations, to measure the detector's sensitivity beyond a single real event.
Live
- SunnyCloudflare Pages, checked on October 15, 2026
Undergraduate thesis in a pair, supervised at UCL.